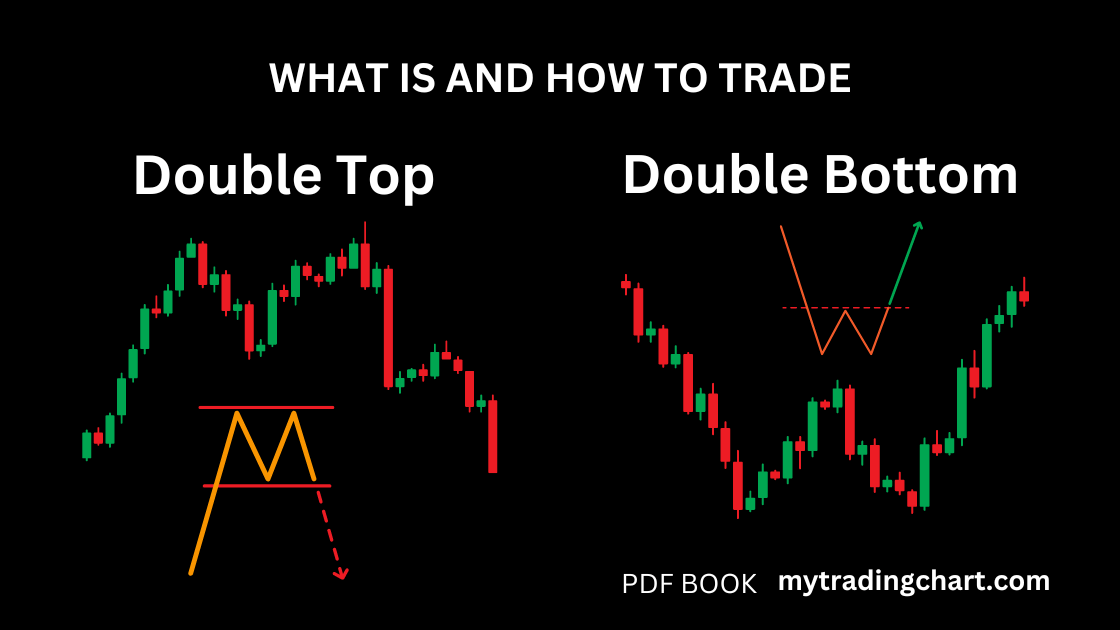
Double Top and Double Bottom Pattern
Double Top
The double top pattern is a technical analysis chart pattern that indicates a possible reversal of an uptrend in the market.This pattern is characterized by two subdimensions that form a “M” shape on the price chart. This pattern typically forms after an extended uptrend and consists of two peaks at approximately the same price level, followed by a dip in the stock’s price. The pattern is considered complete when the price breaks below the “neckline” formed by the low between the two peaks.
How to Trade Double Top Pattern:
The double top pattern has significantly impacted the financial markets, providing traders with valuable information on potential price reversals. When a double top pattern forms, it signals a shift in market sentiment from bullish to bearish, prompting traders to adjust their trading strategies accordingly.
One key benefit of the double top pattern is its ability to help traders identify potential entry and exit points in the market. By recognizing the pattern early on, traders can make informed decisions on when to enter or exit a trade, maximizing their profits and minimizing their losses.
On the other hand, the double top pattern can also be a source of false signals, leading to losses for traders who rely solely on it for their trading decisions. To avoid falling victim to its shortcomings, traders should consider other factors, such as volume, trend lines, and support and resistance levels, when analyzing the pattern.
Double Bottom
The double bottom pattern is a popular technical analysis pattern that traders use to identify trend changes in a stock or market. This pattern is characterized by two subdimensions that form a “W” shape on the price chart. In this essay, we will analyze the historical context of the two-fund model, analyze the main concepts and key figures, analyze the impact on marketing strategies, identify the people with authority in the field, explore different perspectives and discuss ideas for relevant future developments. .
How to Trade Double Bottom Pattern:
The double bottom pattern has had a significant impact on trading strategies and risk management techniques. Traders who are able to identify this pattern early on can potentially capitalize on a trend reversal and profit from the subsequent price movement. By understanding the characteristics of the pattern and the principles behind it, traders can improve their timing and entry points for trades.
However, it is important to note that no pattern is foolproof, and there is always a risk of false signals or failed patterns. Traders should use the double bottom pattern in conjunction with other technical indicators and analysis tools to increase the probability of success and minimize the risk of losses.


Leave a reply