


Unlock better trades! This Candlestick vs Chart Patterns comparison guide reveals key differences, how to combine them, and common pitfalls. Master your market analysis now.
Master the head and shoulders pattern strategy in modern markets. Learn to identify, confirm, and trade this powerful chart formation with advanced techniques and risk…
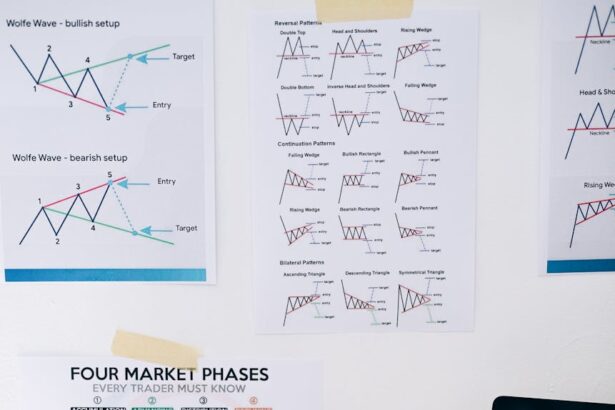
Master the essential chart patterns every trader must know. Unlock powerful technical analysis strategies for stocks, crypto, and forex to boost your trading success.
Discover the most successful chart patterns for profitable trading. Learn…
Chart Pattern PDF Free Download: Your Secret Weapon for Smarter…
Discover the best stock under 1000rs with high growth potential.…
Unlock better trades! This Candlestick vs Chart Patterns comparison guide reveals key differences, how to combine them, and common pitfalls. Master your market analysis now.
Master the fundamental differences, strategies, and definitions behind macro chart formations and micro price action signals.
The core difference lies in timeframe and structure. A candlestick pattern focuses on immediate, short-term market sentiment using anywhere from 1 to 3 individual price bars (e.g., a Doji or Hammer). A chart pattern is a much larger macro-formation built out of dozens or hundreds of candlesticks over days, weeks, or months to reveal a massive structural trend (e.g., Head and Shoulders or Symmetrical Triangle).
Beginners should first learn how to read individual candlestick anatomy (open, close, high, low) to comprehend basic price action. Once you understand what a single candlestick tells you about buyer and seller aggression, you can transition to identifying macro chart patterns, which map out long-term market trends.
Think of a chart pattern as your strategic map and a candlestick pattern as your tactical execution trigger. Professional traders find a macro chart pattern first (like a Double Bottom) to plan an upside bias. Then, they look for a specific reversal candlestick pattern (like a Bullish Engulfing) right at the support line to pinpoint the exact time to buy.
Candlestick patterns fall into three broad structural classifications: Bullish Reversal (signals a transition from a downtrend to an uptrend, like a Hammer or Morning Star), Bearish Reversal (signals an impending drop from an uptrend, like a Shooting Star or Evening Star), and Indecision (signals a temporary stand-off between bulls and bears, like a Spinning Top or neutral Doji).
Candlestick patterns are highly sensitive to market noise on short timeframes (like the 1-minute or 5-minute charts). Because they reflect brief bursts of market sentiment, single candlesticks can easily switch directions based on minor, random trade flows. Their signal strength scales up significantly on 4-hour and Daily charts.
A false breakout occurs when the price pushes past a key chart pattern boundary (support or resistance), tempting retail breakout traders to enter positions, only to sharply reverse direction. Institutional algorithms often intentionally drive prices past visible key lines to trigger stop losses and collect deep liquidity before moving the asset the opposite way.
Volume acts as a momentum validator. If a chart pattern breaks its critical boundary line on **low volume**, the move is likely weak and prone to failure. Conversely, if a pattern clears resistance accompanied by a **sudden massive volume spike**, it indicates strong institutional interest, meaning the breakout is far more likely to stick and continue expanding.
Fractal means that technical configurations behave identically regardless of the chosen timeline scale. A classic Head and Shoulders pattern follows the exact same mechanical math, human psychological loops, and breakdown structures whether you are tracking it on a volatile 5-minute chart or a macro, multi-year weekly stock layout.
Continuation patterns reveal that an existing trend is briefly pausing to digest a large move before continuing in its original direction. Examples include **Bull Flags, Bear Pennants, and Ascending Triangles**. These consolidations reflect profit-taking by early buyers before fresh institutional momentum joins to push the price further.
They are inherently subjective. While basic criteria exist (e.g., a double top requires two peaks), different traders may draw their support lines, trend lines, or wicks differently. Using clear, visual reference guides like the high-definition trading aids on mytradingchart.com helps standardize your tracking layout to eliminate subjective guesswork.
Sign in to your account