


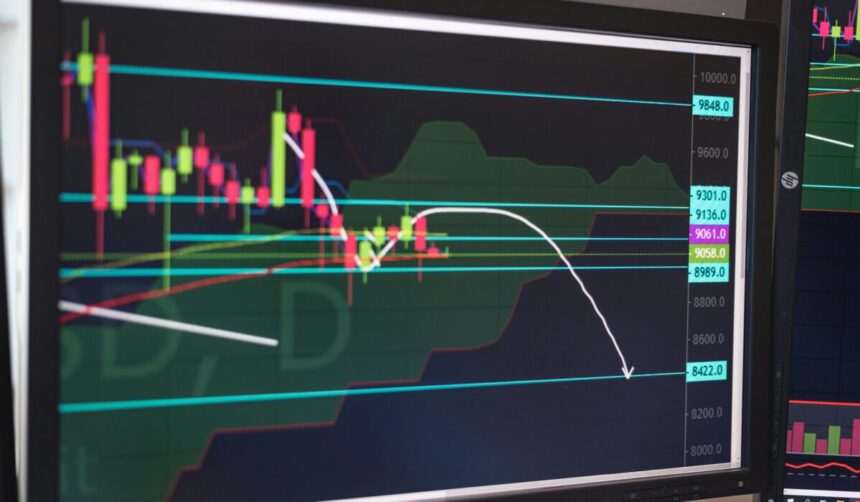
Are you wondering which price movements truly give you an edge in the markets, or how to identify the most successful chart patterns for profitable trading? Understanding these visual guides on a price chart is crucial for any trader looking to predict future price action and make informed decisions, whether you’re navigating the stock market, forex, or crypto trading.
What Are Chart Patterns and Why Do They Matter for Traders?
Chart patterns are distinct formations that appear on price charts, created by the movement of security prices over time. These patterns are fundamental to technical analysis, offering visual representations of potential future price trends.
They matter deeply for traders because they reflect the ongoing battle between buyers and sellers, often signaling either a continuation of the current trend or a potential reversal. Recognizing these patterns can provide valuable insights into market sentiment and help you anticipate significant shifts.
What most people miss is that these aren’t just arbitrary shapes; they are the visual footprint of collective human psychology at play in the market.
Do Chart Patterns Actually Work? Understanding Reliability & Success Rates
The short answer is yes, chart patterns do work, but their effectiveness is not guaranteed and requires careful application. They serve as probabilities, not certainties, guiding your trading strategies with historical tendencies.
Modern 2025 statistics indicate that continuation patterns achieve an impressive 73.7% reliability when correctly identified. This means that when a pattern suggests the trend will continue, it often does.
However, their success rates significantly improve when combined with other indicators and proper risk management. As noted by technical analysis expert Thomas Bulkowski, who quantified their predictive powers, certain patterns demonstrate success rates exceeding 70%.
The Importance of Volume Confirmation
One critical factor in judging a pattern’s reliability is volume confirmation. A breakout from a pattern, whether it’s a reversal or continuation, is far more credible if accompanied by a significant increase in trading volume.
This surge in volume signals strong conviction from market participants, lending more weight to the pattern’s predictive power. Without it, a breakout might be a false signal, leading to whipsaws and losses.
Combining Patterns with Other Technical Indicators
To truly maximize your accuracy, don’t rely on chart patterns in isolation. Combining them with other technical analysis tools, such as moving averages, RSI, or MACD, can dramatically improve your entry and exit points. According to 2025 data, this integrated approach improves accuracy by up to 31%.
For example, if you spot a bullish reversal pattern, confirming it with an oversold RSI reading adds another layer of confidence to your trade. This multi-factor approach builds stronger conviction and reduces false signals.
The Most Successful Chart Patterns Every Trader Must Know
To truly master how to read chart patterns, you need to familiarize yourself with the formations that historically offer the highest probabilities of success. These patterns act as reliable signposts for potential market shifts.
Here are some of the most successful chart patterns that every trader should understand:
- Head and Shoulders (Reversal Pattern): This iconic reversal pattern signals a shift from an uptrend to a downtrend (or vice-versa for inverse Head and Shoulders). It consists of three peaks, with the middle peak (the “head”) being the highest, flanked by two lower peaks (the “shoulders”). A break below the “neckline” confirms the pattern. The Head and Shoulders pattern maintains an 89% success rate when properly confirmed, as quantified by Thomas Bulkowski.
- Double Top/Bottom (Reversal Pattern): These patterns indicate a strong resistance or support level that the price has tested twice without breaking through, signaling an impending reversal. A double bottom pattern achieves 88% success rates in bull markets when volume confirms the breakout above the resistance line, according to 2025 research.
- Triangles (Continuation or Reversal): Symmetrical, Ascending, and Descending triangles represent periods of consolidation before a significant price move. Symmetrical triangles often signal continuation, while ascending (bullish) and descending (bearish) triangles can lean towards continuation or reversal depending on the prior trend. They represent decreasing volatility before an expansion.
- Cup and Handle (Continuation Pattern): Resembling a teacup with a handle, this bullish continuation pattern typically forms during an uptrend, indicating a period of consolidation before the uptrend resumes. According to 2025 statistics, cup and handle patterns demonstrate success rates around 80% when strict formation criteria are applied. An example from a November 2025 article showed a Cup and Handle pattern on a 15-minute EURUSD chart, leading to a successful long trade after the price retested the resistance level.
- Flags and Pennants (Continuation Patterns): These are short-term continuation patterns, usually forming after a sharp, almost vertical price movement. They look like small rectangles (flags) or symmetrical triangles (pennants) and indicate a brief pause before the prior trend continues. They are particularly useful for day trading chart patterns due to their short formation period.
- Wedges (Reversal or Continuation): Wedges are similar to triangles but typically slope either up or down. A rising wedge usually signals a bearish reversal, while a falling wedge suggests a bullish reversal. They can also appear as continuation patterns within a strong trend.
The key to profiting from these patterns is not just knowing their shapes, but understanding the market context in which they appear.
How to Identify and Trade Chart Patterns Effectively
Identifying and trading chart patterns effectively requires discipline, practice, and a systematic approach. It’s not about memorizing shapes, but understanding the underlying market dynamics they represent.
Step-by-Step Identification
1. Zoom Out for Context: Always start by looking at a higher timeframe to understand the prevailing trend. A pattern identified on a 15-minute chart holds less weight if it contradicts the daily trend.
2. Draw Trendlines: Use trendlines to connect significant highs and lows, which will help you define the boundaries of potential patterns like triangles, wedges, or channels. This is a core skill in technical analysis.
3. Look for Confirmation: As discussed, volume confirmation is paramount. A breakout on low volume is often a fakeout. Also, look for confirmation from candlestick patterns at key support or resistance levels, which can provide additional confluence.
4. Identify Pattern Type: Determine if you’re seeing a reversal pattern (like Head and Shoulders or Double Top/Bottom) or a continuation pattern (like Flags or Pennants).
Executing Trades with Patterns
Once you’ve identified a pattern and received confirmation, here’s how to approach trading it:
- Entry Point: Typically, you enter a trade on the breakout from the pattern, often after a retest of the breakout level. This waiting period helps filter out false breakouts.
- Stop Loss Placement: Always place a stop loss to manage your risk. For reversal patterns, a common practice is to place it just beyond the extreme point of the pattern (e.g., above the head in a Head and Shoulders top, or below the lowest bottom in a Double Bottom).
- Target Price: Most chart patterns have a measurable target. For example, the target for a Head and Shoulders pattern is often the height of the head projected downwards from the neckline. For flags and pennants, it’s typically the length of the “pole” projected from the breakout point.
- Combine with Indicators: Use indicators like RSI, MACD, or Bollinger Bands to further validate your entry and exit signals. This multi-indicator approach strengthens your conviction.
In practice, successful traders develop a keen eye for these formations through consistent chart review and backtesting.
Applying Chart Patterns Across Different Markets: Stocks, Crypto, & Forex
While the fundamental principles of technical analysis and chart patterns remain universal, their application can vary subtly across different asset classes due to differences in market structure, volatility, and trading hours.
Stock Market Patterns
In the stock market patterns, classical patterns like the Cup and Handle, Head and Shoulders, and various triangles are highly popular. They tend to form over longer timeframes (daily, weekly) due to the slower, more deliberate price movements of individual stocks compared to other markets. Volume confirmation is exceptionally crucial here, as institutional money drives significant moves. Navigating Stock Market Volatility : 2025 often involves recognizing these larger patterns.
Forex Chart Patterns
Forex chart patterns are often faster-moving due to the 24/5 nature of the market and high liquidity. Patterns like flags, pennants, and double tops/bottoms are very common on shorter timeframes (e.g., 1-hour, 4-hour charts). The high leverage in forex trading means that quick, decisive action based on pattern breakouts is essential, emphasizing strict risk management.
Crypto Chart Patterns
Crypto chart patterns operate in a highly volatile and often less regulated environment. While all classic patterns apply, their formations can be more exaggerated, and breakouts can be extremely rapid. Due to the 24/7 nature and susceptibility to social media sentiment, false breakouts might be more frequent. Traders often look for patterns on multiple timeframes and use robust risk management strategies to mitigate the inherent volatility of crypto trading.
The key takeaway is to adapt your confirmation criteria and risk parameters to the specific characteristics of the market you are trading.
Leveraging Modern Tools and AI for Chart Pattern Recognition
In today’s fast-paced trading environment, manual pattern identification can be time-consuming and prone to human error. Modern tools and artificial intelligence (AI) have revolutionized how traders approach technical analysis patterns.
Automated Pattern Scanners
Platforms like TradingView offer advanced charting capabilities and even an “All Chart Patterns” indicator to automatically display patterns on any timeframe. Similarly, TrendSpider automatically paints popular chart patterns and allows users to scan for them across various markets, chart types, and timeframes. These tools significantly reduce the manual effort involved in spotting developing patterns.
One of the first advanced chart pattern recognition software, Autochartist, enables traders to customize interfaces based on specific instruments, timeframes, pattern types, or even pattern stages. This level of automation is invaluable for traders who track many assets.
AI-Enhanced Platforms and Backtesting
Beyond simple recognition, AI-enhanced platforms can analyze vast amounts of historical data to backtest the efficacy of specific patterns under different market conditions. This allows you to understand the true historical success rates of patterns for particular assets and timeframes.
Research from J.P. Morgan’s AI Research team in 2020 explored identifying patterns in stock time series using unsupervised learning, acknowledging chart patterns as a commonly-used tool in financial data analysis. This highlights the institutional recognition of their value, even with their subjective nature.
For beginners, leveraging tools like TradingView’s “Replay Mode” allows you to practice identifying patterns on historical charts, honing your skills without risking real capital.
The Psychology Behind Repeating Chart Patterns
Chart patterns aren’t random; they are a visual representation of predictable human behavior driven by fear and greed. This is why they tend to repeat across different markets and timeframes.
When you see a Head and Shoulders top forming, it reflects a market that has attempted to push higher, failed, tried again with less enthusiasm, and then failed a third time. This sequence of events signals diminishing buying power and increasing selling pressure, a clear psychological shift.
John Murphy, a foundational figure in technical analysis, emphasized that these patterns are simply illustrations of supply and demand dynamics, influenced by collective investor sentiment. They show us how the crowd reacts to certain price levels and market conditions.
Understanding this underlying psychology transforms patterns from mere shapes into powerful insights into market sentiment. The patterns persist because human emotions in financial markets remain constant.
Frequently Asked Questions
What are the 3 most common chart patterns?
The three most common chart patterns are Triangles (symmetrical, ascending, descending), Head and Shoulders (and its inverse), and Double Tops/Bottoms. These patterns frequently appear across various financial markets and are widely recognized for signaling potential trend continuations or reversals.
Do chart patterns actually work?
Yes, chart patterns do work as probabilistic indicators in technical analysis, providing valuable insights into future price movements. Their effectiveness is significantly enhanced when combined with volume confirmation and other technical indicators, improving overall success rates for traders.
What is the most reliable chart pattern?
While reliability can vary with market conditions and asset class, the Head and Shoulders pattern is often cited as one of the most reliable reversal patterns, boasting an 89% success rate when properly confirmed. Continuation patterns like flags and pennants also show high reliability (around 73.7%) for trend continuation.
What is the most common chart pattern?
Triangles (symmetrical, ascending, and descending) are arguably the most common chart patterns you’ll encounter. They represent periods of consolidation and indecision, frequently appearing before a significant breakout in either direction, making them a staple in any trader’s toolkit.
Mastering chart patterns is a journey that combines technical understanding with psychological insight. By focusing on the most successful chart patterns, integrating modern tools, and applying sound risk management, you can significantly enhance your trading strategies and improve your chances of profitability. Start practicing identification on historical charts today to build your expertise and confidence.