


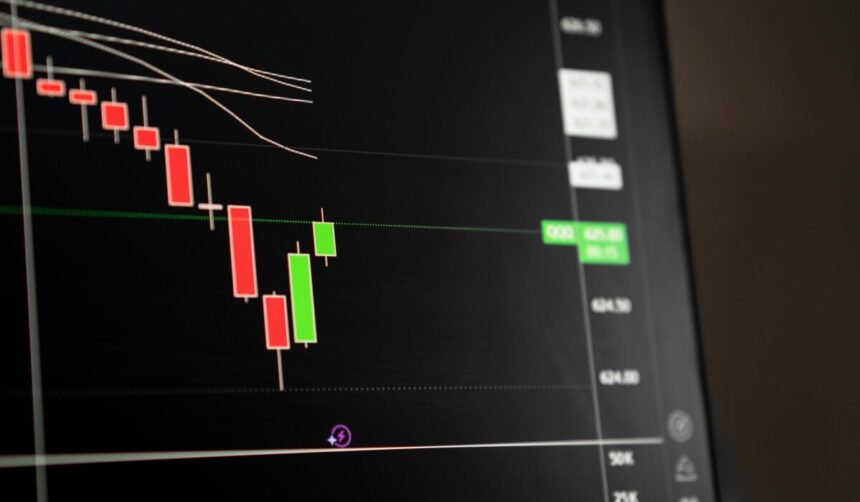
If you’re looking to gain a significant edge in the markets, understanding Chart Patterns Every Trader Must Know is absolutely crucial for making informed decisions. Navigating the unpredictable currents of stocks, crypto, and forex requires more than just luck; it demands a systematic approach to price action. This comprehensive guide will equip you with the essential knowledge to identify, interpret, and strategically trade the most impactful chart patterns, transforming your market analysis.
What Are Chart Patterns and Why Do Traders Need Them?
Chart patterns are distinct geometric shapes that form on price charts, created by the ebb and flow of supply and demand over time. They are visual representations of market psychology, reflecting the collective actions of millions of traders and investors. Understanding these patterns is a cornerstone of effective technical analysis, offering crucial insights into potential future price movements.
Traders need these patterns because they provide a structured framework for anticipating market shifts, identifying high-probability entry and exit points, and establishing clear trading strategies. As Fred McAllen, author of “Charting and Technical Analysis,” wisely states, “Charts really are the ‘footprint of money.'” This means that every pattern tells a story about the ongoing battle between buyers and sellers, helping you decipher market sentiment.
By recognizing these recurring formations, you gain a powerful predictive edge. They allow you to visualize where price might go next, whether it’s a continuation of an existing trend or an impending reversal, making them indispensable tools for any serious trader.
What Are the Main Types of Chart Patterns?
Chart patterns generally fall into three primary categories, each signaling a different market dynamic. Mastering these fundamental types is essential for any trader looking to improve their market timing and decision-making.
Reversal Patterns
These patterns signal that an existing trend is likely to change direction. They form at the end of an uptrend or downtrend, indicating that momentum is shifting. Recognizing these early can help traders exit losing positions or enter new trades anticipating the turn.
- Head and Shoulders (and Inverse Head and Shoulders): A classic and highly reliable reversal pattern, forming with three peaks (or troughs), the middle one being the highest (or lowest). It signals a probable trend reversal from bullish to bearish, or vice-versa.
- Double Top and Double Bottom: These patterns feature two distinct peaks (or troughs) at roughly the same price level, separated by a valley (or peak). They indicate a strong resistance (or support) level that the price has failed to break, leading to a reversal.
- Triple Top and Triple Bottom: Similar to double tops/bottoms but with three peaks or troughs, suggesting an even stronger struggle at a key price level before a reversal.
Continuation Patterns
Unlike reversal patterns, these formations suggest that the current trend is merely pausing before continuing in its original direction. They represent periods of consolidation where buyers and sellers are taking a breather before the dominant trend reasserts itself.
- Triangles (Ascending, Descending, Symmetrical): These patterns involve converging trendlines, indicating a period of indecision. Ascending triangles are generally bullish, descending are bearish, and symmetrical triangles can break in either direction. They are reliable continuation patterns but can also act as reversals.
- Flags and Pennants: Small, brief consolidation patterns that appear after a sharp, strong price move (the “flagpole”). They represent a short pause before the trend resumes with renewed vigor. Bull flags and bear flags are common `best chart patterns for day trading`.
- Rectangles: Price consolidates horizontally between parallel support and resistance levels. A breakout from the rectangle usually signals a continuation of the prior trend.
Bilateral Patterns
These patterns are unique because they can signal a breakout in either direction, making them tricky but potentially highly profitable. Traders must wait for clear confirmation of the breakout before entering a trade.
- Symmetrical Triangle: While often a continuation pattern, a symmetrical triangle can also be bilateral. Both the resistance and support lines are converging, indicating increasing uncertainty before a decisive move.
Understanding these categories helps you anticipate market behavior more effectively, laying the groundwork for more sophisticated `trading strategies`.
Which Chart Pattern Is Most Successful and Accurate?
The quest for the “most successful” or “highest accuracy” chart pattern is common among traders. While no pattern guarantees 100% success, statistical research provides valuable insights into their reliability. According to extensive research by Thomas Bulkowski, a renowned expert in chart patterns, some formations consistently outperform others.
The **Head & Shoulders pattern** is widely regarded as one of the most reliable reversal patterns, boasting a reported success rate of 89% in signaling reversals. Similarly, **Triangle patterns** are highly effective as trend continuation patterns, with an impressive 88% success rate. Double Top and Double Bottom patterns also signal strong reversal points with an 87% success rate.
Beyond traditional chart patterns, Bulkowski’s research also highlights specific candlestick formations. For instance, the Bearish Three Line Strike candlestick reversal pattern produces bullish reversals 84% of the time under proper conditions, making it one of the most statistically reliable candlestick setups tested. A 2012 study by Yung-Shun Tsai found that bullish pennant patterns had a 67.8% success rate in predicting trend continuations.
What most people miss is that the success rate of any pattern is significantly boosted by volume confirmation. Increased volume during a breakout validates the pattern’s signal, indicating strong institutional interest. While these statistics are compelling, remember that a general success rate for well-used chart patterns typically ranges from 50-70%, with favorable risk-reward ratios, as noted in the “Encyclopedia of Chart Patterns.”
How Do Chart Patterns Behave in Stocks, Crypto, and Forex?
While chart patterns are universal, their behavior, reliability, and frequency can vary significantly across different markets due to their unique characteristics and underlying dynamics. Understanding these nuances is crucial for applying Chart Patterns Every Trader Must Know effectively.
Stock Market Patterns
In the stock market, patterns often develop over longer timeframes and tend to be less volatile than in other markets. Fundamental news, earnings reports, and economic data play a significant role in influencing `stock market patterns`. For example, a **Double Top** in a well-established company might take weeks or months to fully form, reflecting a gradual shift in investor sentiment.
Traders focusing on `technical analysis patterns for stock trading` often look for patterns confirmed by strong volume, as this indicates genuine institutional participation. Gaps, like a Breakaway Gap after a downward trend with high volume, can signal a robust reversal, as seen in some historical stock examples.
Cryptocurrency Trading
The world of `cryptocurrency trading` is notorious for its extreme volatility and rapid price swings. This environment can lead to patterns forming much faster and, sometimes, with more “fakeouts” or false breakouts compared to traditional markets. Sentiment, social media trends, and regulatory news can dramatically impact `chart patterns for crypto trading 2024`.
For instance, a **Bull Flag** in a meme stock or a rapidly appreciating altcoin might unfold in a matter of hours on shorter timeframes, demanding quick reactions. While patterns like **Head and Shoulders** tops can be highly effective in predicting downturns in crypto, as observed in Dr. Sarah Evans’ 2020 study on “Pattern Recognition in Bearish Markets,” which found a 70% success rate when confirmed with volume.
Forex Chart Patterns
The forex market is the largest and most liquid financial market, operating 24/5. This high liquidity often leads to cleaner, more textbook pattern formations, especially on major currency pairs. However, `forex chart patterns` are highly sensitive to economic data releases, central bank announcements, and geopolitical events.
A **Bull Flag** or **Bear Flag** pattern can be particularly effective for `day trading` in forex, such as on a 30-minute USDJPY chart, where a sharp price move (flagpole) is followed by a period of consolidation (flag). The swiftness of forex movements means traders must be precise with their entry and exit points, often using patterns to identify these critical levels. `Forex chart patterns analysis` also benefits from considering correlated currency pairs.
In practice, adapting your interpretation and trading strategies to the specific market you’re trading is paramount for success. What works flawlessly in one asset class might require adjustments in another.
Combining Chart Patterns with Other Technical Indicators for Confluence
While recognizing Chart Patterns Every Trader Must Know is powerful, their predictive accuracy significantly increases when combined with other `trading indicators`. This concept is known as **confluence**, where multiple independent indicators or analysis methods provide the same signal, reinforcing the likelihood of a particular outcome.
Here’s the thing: relying solely on one pattern is like driving with one eye closed; combining tools offers a much clearer view of the road ahead. For example, if you spot a **Head and Shoulders** reversal pattern forming at a major resistance level, you wouldn’t just jump in. You’d look for additional confirmation.
Consider these combinations:
- Chart Pattern + Oscillators (RSI, Stochastic, MACD): A **Double Top** reversal pattern becomes much stronger if the Relative Strength Index (RSI) shows overbought conditions and then divergence (price makes a higher high, but RSI makes a lower high). This signals weakening momentum despite the price action.
- Chart Pattern + Moving Averages: A **Bull Flag** breakout above a critical moving average (e.g., the 50-period EMA) adds weight to the continuation signal. Conversely, a **Bear Flag** breaking below a moving average confirms bearish momentum.
- Chart Pattern + Fibonacci Retracements: If a **Triple Bottom** pattern forms precisely at a significant Fibonacci retracement level (like 61.8% or 78.6%) of a prior move, it provides a strong area of support. This confluence signals a high-probability reversal point.
- Chart Pattern + Volume Confirmation: As emphasized by experts like Thomas Bulkowski, `volume confirmation` is indispensable. A breakout from any continuation or reversal pattern should ideally be accompanied by a surge in trading volume to validate the move. Without it, the breakout might be a false signal.
By integrating chart patterns with these complementary `technical analysis` tools, you build a more robust case for your trading decisions. This advanced approach moves beyond basic pattern recognition to a comprehensive `trading strategy` that significantly enhances your edge in the market. Platforms like TradingView make it easy to layer various indicators over identified patterns.
Can You Truly Rely on Chart Patterns for Trading Decisions?
The short answer is: yes, you can rely on chart patterns for trading decisions, but with a critical understanding of their probabilistic nature and the necessity for a comprehensive approach. No single indicator or pattern provides a 100% guarantee in the unpredictable world of financial markets. Chart patterns are powerful tools that offer a probabilistic edge, not a crystal ball.
As Fred McAllen states, “Chart patterns are very accurate. They have proven their accuracy and predictability time and time again, but you have to wait for them to develop.” This highlights the importance of patience and confirmation. The general success rate for chart patterns, when used effectively with sound `trading strategies`, typically falls within the 50-70% range, often with attractive risk-reward ratios.
What most people miss is that successful reliance on chart patterns hinges on several factors: confirming patterns with other `technical analysis` tools (confluence), understanding market-specific behavior, and rigorously applying `risk management in trading`. Without these supporting pillars, even the most reliable pattern can lead to losses. Therefore, while patterns are highly valuable, they should always be part of a broader, well-defined trading plan rather than the sole basis for decisions.
Advanced Risk Management and Psychology for Trading Chart Patterns
Even the most reliable chart pattern can lead to losses if emotional biases or poor `risk management in trading` dictate your actions. Mastering the psychological aspects and tailoring your risk strategy to specific patterns is what separates consistent traders from the rest. This is a key component of `advanced chart patterns trading strategies`.
Tailoring Stop-Loss and Take-Profit Levels
Effective risk management isn’t just about placing a generic stop-loss; it’s about setting it strategically based on the pattern’s structure and potential failure points. For instance:
- Head and Shoulders: For a Head and Shoulders top, place your stop-loss just above the right shoulder’s peak. Your take-profit target is typically measured by projecting the height of the pattern (from head to neckline) downwards from the breakout point.
- Double Top/Bottom: For a Double Top, a stop-loss should be placed slightly above the second peak. The take-profit target can be derived by subtracting the height of the pattern (from the peaks to the valley) from the breakout point of the neckline.
- Flags and Pennants: For a Bull Flag, the stop-loss is typically set below the consolidation range of the flag. The profit target is often projected by adding the length of the flagpole to the breakout point of the flag.
Always ensure your potential profit outweighs your potential loss, aiming for a risk-reward ratio of at least 1:1.5, or even 1:5 and higher, depending on the time horizon and pattern reliability. This systematic approach is detailed in resources like “Most Successful Chart Patterns for Profitable Trading.”
Overcoming Psychological Biases
Your mind can be your biggest asset or your worst enemy when trading chart patterns. Here are common biases and how to combat them:
- Confirmation Bias: The tendency to only see patterns that support your existing market view. To counter this, actively look for opposing patterns or signals, and ensure your analysis is objective.
- Fear of Missing Out (FOMO): Entering a trade too early before a pattern is fully confirmed or chasing a breakout. Stick to your trading plan and wait for clear `volume confirmation` and price action. Jesse Livermore, known as “The Great Bear of Wall Street,” emphasized patience and waiting for the right moment.
- Overtrading: Seeing patterns everywhere, even where they don’t clearly exist. Focus on high-quality setups and resist the urge to trade constantly. Paul Tudor Jones, a renowned macro trader, is famous for his precise entry and exit points and strict risk management.
Maintaining a trading journal and reviewing your trades can help you identify and mitigate these psychological pitfalls, fostering the discipline needed to trade Chart Patterns Every Trader Must Know successfully.
What Are the Best Timeframes and Tools for Trading Chart Patterns?
Choosing the right timeframe and utilizing effective tools are critical for accurately identifying and trading chart patterns. There isn’t a single “best” timeframe; rather, it depends entirely on your `trading strategies` and personal objectives.
Optimal Timeframes
Different timeframes reveal patterns of varying sizes and implications:
- Short-Term (1-minute, 5-minute, 15-minute): These timeframes are ideal for `best chart patterns for day trading`, where patterns like **Flags**, **Pennants**, and **Rectangles** can unfold rapidly. They require quick decision-making and precise execution.
- Medium-Term (1-hour, 4-hour, Daily): Swing traders often use these timeframes for patterns such as **Head and Shoulders**, **Double Tops/Bottoms**, and larger **Triangles**. These patterns offer more significant moves and allow for more breathing room.
- Long-Term (Weekly, Monthly): For investors or long-term position traders, these charts reveal major `reversal patterns` and `continuation patterns` that can signal multi-month or multi-year trends. The signals here are fewer but often extremely powerful.
The key is to use multiple timeframes for analysis. Identify the overall trend on a higher timeframe, then zoom into a lower timeframe to pinpoint entry and exit points using specific patterns. This multi-timeframe approach provides context and reduces false signals.
Essential Tools for Pattern Recognition
Modern technology has made identifying `most reliable chart patterns` more accessible than ever, especially for `chart patterns for beginners`.
- Charting Platforms: Platforms like **TradingView**, **MetaTrader 4/5** (with plugins), and **TrendSpider** are indispensable. They offer robust charting capabilities, drawing tools, and access to a vast array of `trading indicators`. Many educational resources, such as Zeiierman Trading, extensively use TradingView to illustrate patterns like Double Tops on various assets.
- AI-Powered Pattern Recognition Tools: Platforms like **TrendSpider** excel in automatically identifying formations such as triangles, flags, and head-and-shoulders. These AI-powered tools save traders time, reduce manual effort, and help remove subjective bias from identification. You can explore more about these tools in resources like The Ultimate Guide to Chart Patterns from TrendSpider.
- Educational Resources: Beyond tools, access to comprehensive guides and cheat sheets, like a Chart Pattern Pdf Download, can significantly accelerate your learning curve.
The right timeframe aligns with your trading style and allows patterns to develop with sufficient clarity without too much noise or too few opportunities. Combined with powerful charting tools, you have a potent setup for successful pattern trading.
Frequently Asked Questions
Which chart pattern is most successful?
The Head & Shoulders pattern is widely considered one of the most successful, with a reported 89% success rate in signaling reversals. Other highly accurate patterns include Triangles (88% success for continuation) and Double Tops/Bottoms (87% success for reversals), especially when confirmed by volume and other technical indicators.
What are the 3 main types of chart patterns?
The three main types of chart patterns are reversal patterns, continuation patterns, and bilateral patterns. Reversal patterns signal a change in trend, continuation patterns suggest a temporary pause before the trend resumes, and bilateral patterns can break out in either direction, requiring careful confirmation.
Can I rely on chart patterns for trade?
Yes, you can rely on chart patterns for trading, but they should be used as probabilistic tools, not guarantees. Their reliability significantly increases when combined with other technical indicators for confluence, robust risk management, and an understanding of market-specific nuances. Expert traders integrate them into a broader, well-defined trading strategy.
Is it possible to automate best pattern recognition?
Yes, it is possible to automate pattern recognition using advanced charting platforms and AI-powered tools. Platforms like TrendSpider leverage algorithms to automatically identify various chart patterns such as triangles, flags, and Head & Shoulders formations, saving traders time and reducing human bias in their analysis.
Mastering **Chart Patterns Every Trader Must Know** is a journey that requires dedication, practice, and a continuous learning mindset. These visual cues on your charts are more than just